Unlocking Growth with Amazon Price History

Written by

Cosmy
AI-driven eCommerce Optimization
Amazon's price history is more than just a record of old prices. It’s a detailed story of your product on the marketplace, revealing demand cycles, competitive pressures, and the overall health of your market. Understanding this story turns simple price tracking into a powerful tool for making smarter business decisions.
What Price History Reveals About Your Product

A product’s price history acts like its financial heartbeat. A price graph shows you how stable a product is and how it reacts to market pressure. For brands, this information is invaluable. It helps you make better decisions on everything from managing inventory and planning promotions to responding to competitors. To gather this data efficiently, many brands use an Amazon Scraper to collect the necessary information automatically.
Most price tracking tools show data for three main price points. Each one tells a different part of your product's story.
The Three Core Price Components
Understanding these three prices is the first step. Each offers a clear view of the supply, demand, and competition affecting your product.
Amazon's Price: This is the price set by Amazon when it sells the product directly. It is often the most stable price and serves as a benchmark for the product's value.
Third-Party New: This is where things get interesting. This price shows what other sellers are charging for the same product in "new" condition. If this price fluctuates wildly, it signals intense competition or possible inventory shortages.
Third-Party Used: This tracks the price for used or refurbished versions of your product. It’s a useful way to measure the secondary market and understand your product's long-term value.
These three prices rarely move together. For example, a look at the Indian marketplace for a product with the ASIN B071YRQN6B reveals how dynamic pricing can be. While Amazon's price stayed within a 33% range, third-party "new" prices soared by 1,479% from their lowest point, particularly during major shopping festivals. This shows how aggressively other sellers react to spikes in demand—a vital piece of information for any brand manager. You can explore these dynamics for yourself on camelcamelcamel.com.
Example: If the third-party new price drops suddenly while Amazon's price stays the same, it could mean a new competitor is trying to win the Buy Box by aggressively cutting their price.
Tracking these trends helps you anticipate market shifts instead of just reacting to them. By analyzing the data linked to a product's Amazon Standard Identification Number (ASIN), you can uncover these patterns. For a quick overview, read our guide on unlocking your Amazon ASIN for sellers.
How Price Changes Impact Your Visibility and Sales
On Amazon, a product's price is more than just a number; it’s a tool that directly affects your visibility and sales. A smart, data-informed price adjustment can push your product up in search rankings, while a random price increase can make it nearly invisible.
Think of your price as a signal to both Amazon's algorithm and your customers. If your pricing is inconsistent, you lose trust. Sharp price swings make shoppers suspicious and can make your advertising campaigns less effective.
The Algorithm and The Buy Box
Amazon’s goal is to offer customers the best possible deal. The A9 algorithm is designed to reward products that help achieve this. When your product is priced competitively, it signals good value, which leads to more sales—a key metric for Amazon’s algorithm.
A high conversion rate tells the algorithm that shoppers like your product, which boosts its ranking in search results. If your price is too high compared to competitors, your conversion rate will likely fall, signaling a less attractive offer and pushing your product down the search page.
This is most apparent in the competition for the Buy Box. Winning the Buy Box is essential, as most sales happen through it. Price is one of the most important factors in determining the winner. To compete, your pricing strategy must be both competitive and stable. We explain this in more detail in our guide on how to master the Buy Box on Amazon.
A reactive pricing strategy—where you constantly adjust to match competitors—is a recipe for failure. A proactive approach, based on solid Amazon price history data, allows you to anticipate market changes and stay in control.
Building Shopper Trust Through Pricing Transparency
Today’s shoppers are savvy. They understand that prices change, but they can easily spot dishonest tactics. For example, raising a price right before a sale just to offer a "discount" back to the original price damages your brand's reputation.
Amazon is taking steps to prevent this. For instance, Amazon India introduced a 'Price History' feature in its app, showing shoppers price graphs from the past 30 or 90 days. This was a response to a major issue: 62% of shoppers felt they had been misled by fake deals during sales events. By providing this data, Amazon helps customers see which discounts are genuine.
This move toward transparency means your pricing strategy must be honest. When your promotions are backed by a fair price history, you not only make a sale but also build long-term trust, turning a one-time buyer into a loyal customer.
For a deeper look into the effects of pricing, check out this guide on mastering Amazon pricing changes. Ultimately, your approach to pricing directly impacts key metrics like search rank, conversions, and revenue, making it a critical part of your growth strategy.
Reading Price History Charts Like an Expert
Looking at an Amazon price history chart can seem complicated at first, with its zig-zagging lines and different colors. But once you understand what to look for, these graphs tell a clear story about your product's performance on the marketplace.
The key is to move beyond just seeing the price and start recognizing the patterns behind the changes. A price history chart is a visual record of supply, demand, and competition. Learning to read these signals helps your team make confident, data-driven decisions instead of just reacting to the market.
Identifying Key Chart Elements
Most price tracking tools use a standard format. Understanding these basic components is the first step.
The Time Axis (X-axis): This horizontal line at the bottom shows the date range. You can usually adjust it to view data from the last month, a year, or the entire history of the product listing.
The Price Axis (Y-axis): The vertical line on the side shows the price in your local currency. This helps you see the scale of the price changes.
Price Lines: These are the colored lines that move across the chart. There are typically separate lines for Amazon's price, new offers from third-party sellers, and sometimes used offers.
For example, this screenshot from a popular price tracker shows the price history for a product.
The different colors here tell a clear story. Notice how Amazon's price (green) remains relatively stable, while the third-party sellers (blue and orange) have much more volatile prices. This is a sign of a highly competitive market.
Recognising Critical Price Patterns
Once you understand the basics, you can start looking for important patterns that reveal what’s really happening in the market.
A common example is the seasonal peak and trough. For a winter coat, you would expect prices to rise in the fall and fall in the spring. Identifying this rhythm allows you to plan inventory and promotions in advance, aligning your strategy with consumer behavior.
Another key pattern is the price ceiling and floor. The ceiling is the highest price customers are willing to pay, while the floor is the lowest you can go without hurting your brand or profits.
By observing these boundaries over a year or more, you can define a safe pricing range for your product. This prevents you from making impulsive decisions that could damage your margins or brand reputation.
Promotional events like Lightning Deals also create a distinct pattern. You'll see a sharp, temporary price drop, which should be followed by an increase in sales rank. Analyzing what happens after the promotion ends reveals its true return on investment. Did the sales momentum continue, or did everything return to normal?
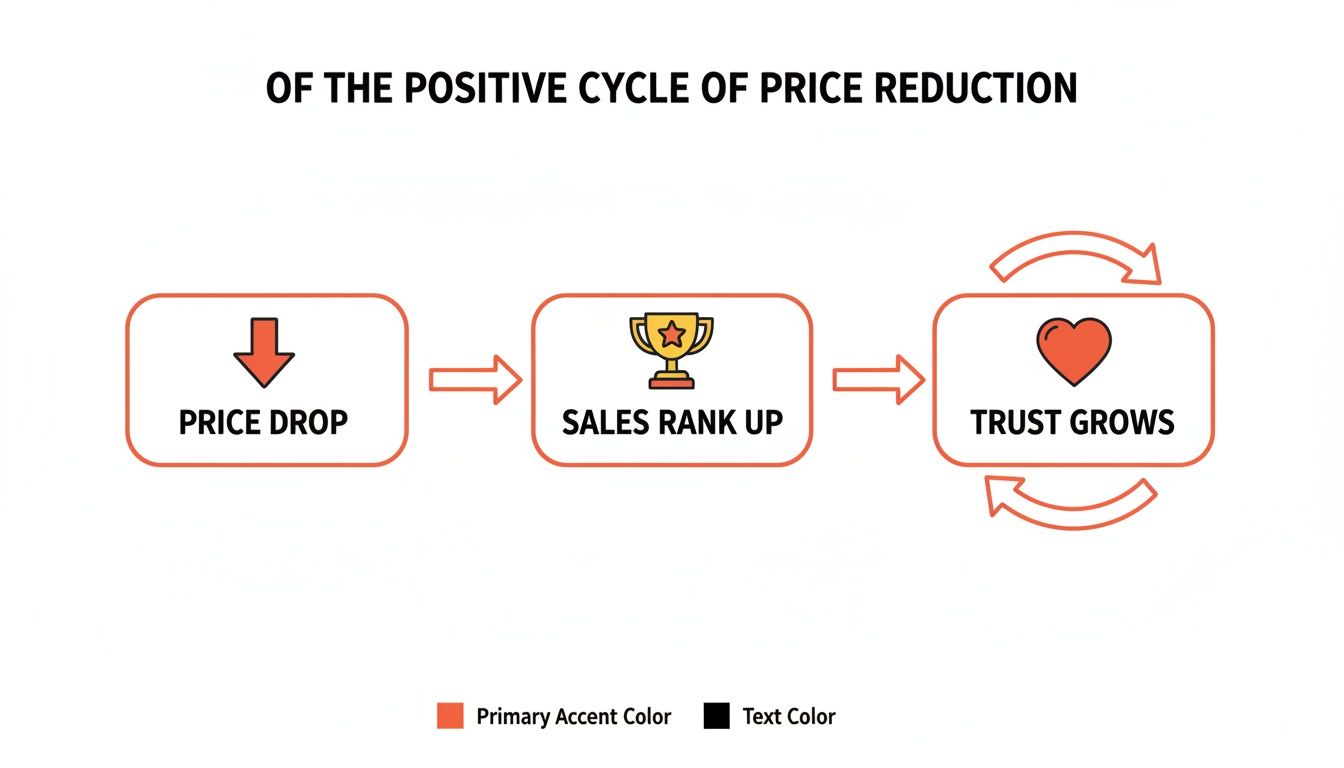
This simple diagram shows the positive cycle that a well-timed price reduction can create.
A strategic price drop can improve your sales rank, which in turn builds customer trust and creates momentum for your product.
Validating Your Data Sources
While Amazon provides some basic data, third-party price trackers are necessary for a complete picture, especially in fast-moving markets like India. These tools often store price history for months or years, well beyond Amazon's standard 90-day view.
They can also distinguish between different types of offers. For instance, understanding how coupons affect the final price is important when 55% of discounts on Amazon.in are from such promotions. Some advanced tools even use AI to detect suspicious price increases just before major sales, giving you a clearer view of your competitors' strategies. You can learn more about how these tools operate on cashify.in. Using multiple data sources helps you build a more reliable foundation for your strategy.
Applying Price Data Across Your Teams
Knowing your Amazon price history is one part of the equation. Using that knowledge to gain a competitive advantage is the real challenge. The most value comes when this data is shared across your teams to guide their daily decisions.
Each department can use these insights to refine its strategies, moving from reactive guesswork to proactive, data-informed actions.
When your brand, content, and marketing teams all understand the story behind your pricing, their efforts become more coordinated. A promotional campaign is no longer just a creative idea; it becomes a strategic move, perfectly timed with a historical price dip. A new competitor isn't just a threat; their pricing strategy becomes a public record you can analyze and counter.
A Playbook for Brand Managers
For brand managers, price history is a key tool for protecting brand value and maintaining market stability. The most direct applications are in competitor analysis and policy enforcement.
By tracking the price movements of your main competitors, you can identify their habits. Do they consistently offer promotions in the second week of the month? Do they lower prices whenever a new seller appears? Understanding these patterns gives you a significant advantage in planning your own promotional calendar.
Another critical task is enforcing your Minimum Advertised Price (MAP) policy. Price history charts provide the concrete evidence needed when a seller violates your policy.
Identify Violators: Set up alerts to notify you whenever a seller's price drops below your MAP threshold.
Collect Evidence: A historical price graph serves as a clear, time-stamped record of the violation, which is crucial for conversations with non-compliant partners.
Demonstrate the Impact: You can show how one seller's violation affects your own sales and pressures other sellers to lower their prices. This data helps prove how a single rogue seller can trigger a price war.
When you monitor pricing systematically, you stop reacting to individual violations and start building a sustainable policy that protects your brand's value across the marketplace.
Aligning Content and Promotions
Your content team's job is to tell a compelling story about your product. Price history provides a great opportunity to make that story more relevant to shoppers looking for a good deal.
For example, if your product is at its lowest price in six months, that’s a powerful message. Instead of a generic "On Sale!" banner, your A+ Content could say, "The Best Value All Year." This aligns your messaging with a verifiable fact, building trust and creating a genuine sense of urgency.
Here’s another example. If you know a competitor's product usually becomes more expensive in November, you can plan a content campaign in October that highlights your product's stable pricing and better long-term value. This turns a simple price point into a strategic advantage.
Optimising Ad Spend for Performance Marketers
For your performance marketing team, historical price data is essential for forecasting demand and maximizing your return on ad spend. The Amazon advertising platform is an auction, and bids become more expensive as competition increases. Price history often shows exactly when these competitive peaks occur.
If your data indicates that prices in your category increase during Prime Day, you can assume that advertising costs will also rise. A smart marketer can use this insight to adjust their strategy:
Allocate Budget Wisely: Instead of spending your entire budget when bids are at their highest, you could invest more in the weeks before the event to attract early shoppers.
Forecast Demand: Consistent, seasonal price drops are a strong indicator of predictable increases in demand. Use this information to ensure your campaigns are funded and ready during these key periods to capture as many sales as possible.
Incorporating Amazon price history into your operations gives every team a clearer view of the market. It allows brand managers to protect brand value, content creators to build trust, and marketers to invest their budgets more effectively. It helps everyone in your organization work together to succeed on Amazon.
Weaving Price Insights into Your Workflow
Knowing your Amazon price history is useful, but turning that knowledge into a real competitive advantage requires a solid process. Without a clear workflow, data is just noise. The goal is to make data analysis a regular part of your operations.
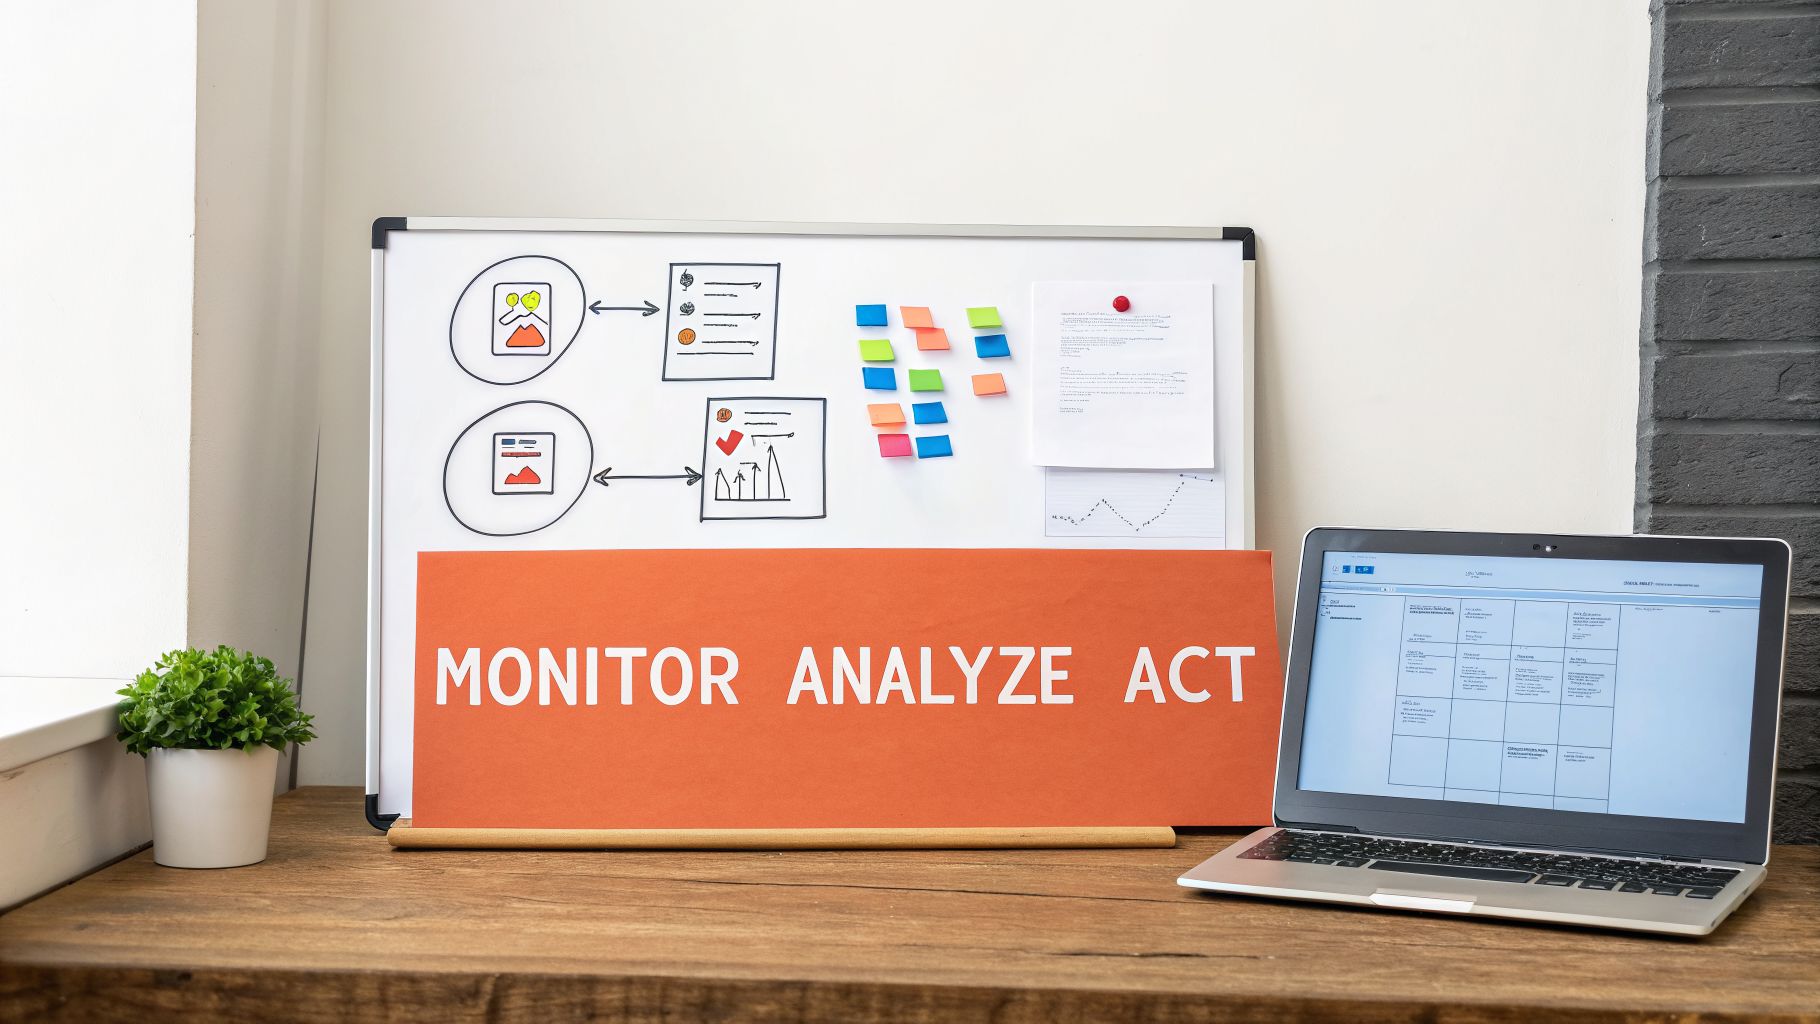
By embedding price analysis into your team's routine, you can stop reacting to the market and start shaping it. A simple framework—Monitor, Analyse, Act—provides a clear path for turning raw data into repeatable successes.
Monitor Key Products and Competitors
First, you need to establish a system for listening to the market. Monitoring involves setting up an automated way to track the prices of your most important products and those of your direct competitors.
This should not be a manual task of checking pages every day. Instead, use price tracking tools to create smart alerts. These act as an early-warning system, notifying you as soon as a significant price change occurs.
Focus your monitoring on specific triggers that are important to your business.
Your Own Price Changes: Receive an alert if one of your product's prices changes unexpectedly. This could be a repricing error or an issue with an unauthorized seller.
Competitor Price Drops: Be notified immediately when a key competitor lowers their price, especially if it threatens your position in the Buy Box.
Price Thresholds Being Crossed: Set alerts for when a product's price falls below your profitability floor or rises above a historical ceiling.
This proactive monitoring frees your team from manual checks, allowing them to focus on more strategic work.
Analyse Price Shifts and Performance Metrics
When you receive an alert, the next step is to understand its significance. A price drop on its own means little. The real insight comes from connecting it to other key performance metrics. The purpose of analysis is to answer the question: "Why does this price change matter?"
This is where you connect the price event to changes in your product's performance on Amazon. A sudden price drop from a competitor is a strategic move aimed at your sales.
By linking pricing data to sales rank, conversion rates, and ad performance, you begin to see the cause-and-effect relationships that drive success on Amazon. This transforms a simple price alert into a valuable business insight.
For example, did your competitor's 10% price cut result in a 20% increase in their Best Sellers Rank (BSR)? Did your own promotional discount improve the click-through rate on your sponsored ads but hurt your profit margin? This is the level of analysis needed to understand the real-world impact of pricing decisions. For a deeper look at how Amazon processes this data, a brand manager's guide to the Amazon Product API is a helpful resource.
Act with Data-Backed Optimisations
The final step is to turn insight into action. With a clear understanding of what happened and why, you can make informed decisions to defend your market share, increase visibility, or protect your profits. This is about executing a specific, data-supported plan.
The "Act" phase can involve various actions, depending on your analysis.
Example 1: The Buy Box Reclamation
Monitor: An alert informs you that a competitor undercut your price by £2 and took the Buy Box for your top-selling ASIN.
Analyse: You check your dashboard and see that your session count for that product has dropped by 40% in the last three hours.
Act: You make a small price adjustment to match or slightly beat the competitor, immediately reclaiming the Buy Box and restoring your sales velocity.
Example 2: The Value-Driven Content Update
Monitor: A tracker shows that your product is at its lowest price in the last 12 months.
Analyse: You confirm it is a planned promotion, but your A+ Content does not mention this significant discount.
Act: Your content team updates the A+ Content headline to "Best Price All Year – Limited Time!" and creates a social media post about the historic low price. This drives external traffic and maximizes conversions from the sale.
This three-step workflow—Monitor, Analyse, Act—creates a powerful feedback loop. It ensures your team is constantly learning from the market and turning those lessons into actions that protect your brand and drive growth. It is how you make mastering your Amazon price history a standard part of your business operations.
To make this practical, here's a step-by-step table outlining how teams can build this process into their regular Amazon optimization routine.
Phase | Key Activity | Objective | Tool/Method |
|---|---|---|---|
Monitor | Set up automated price tracking for key ASINs (yours and competitors'). | Establish an early-warning system for significant market movements. | Price tracking software (e.g., Cosmy), custom API scripts. |
Analyse | When an alert triggers, cross-reference the price change with sales rank, sessions, and conversion data. | Understand the immediate impact and answer "Why does this matter?" | Amazon Seller Central reports, brand analytics dashboards, internal data tools. |
Act | Execute a pre-defined response based on the analysis. | Implement a targeted adjustment to either counter a threat or capitalise on an opportunity. | Repricing tools, manual price adjustments, content updates (A+ Content), ad campaign adjustments. |
Review | Weekly or bi-weekly, review the outcomes of all actions taken. | Measure the effectiveness of your responses and refine your playbooks. | Team meetings, performance review dashboards, A/B testing results. |
By following this structured approach, your team can move from being reactive to being a proactive force on the marketplace, consistently making smarter, data-informed decisions.
Got Questions About Amazon Price History?
As you begin to explore Amazon price history, several questions often arise. Let's address the most common ones that brand managers ask, so you can use this data with confidence.
How Far Back Should I Look to Get Real Insights?
While some tools, including Amazon's own, might only show 30 to 90 days of data, you should aim for at least one full year of Amazon price history for any meaningful strategic planning. A shorter timeframe can leave you with significant blind spots.
Why a full year? Because it provides the complete picture.
Seasonal Swings: You can see predictable patterns, like the pre-summer demand for garden furniture or the post-holiday decline for fitness equipment. A 90-day window cannot capture this.
Big Sale Events: It reveals the true impact of major shopping holidays like Prime Day and Black Friday on your category’s pricing and sales.
Price Anchoring: It establishes a solid baseline for your product's typical price range, making it easy to spot when something is unusual.
This doesn't mean short-term data is useless. A 30 or 60-day view is useful for quick, tactical decisions, such as reacting to a competitor's price drop or measuring the immediate impact of a Lightning Deal. However, for reliable forecasting and long-term strategy, year-over-year analysis is essential.
Can I Trust Third-Party Trackers to Be 100% Accurate?
Third-party price trackers are very useful, offering a depth of historical data that Amazon does not provide. However, it's best to treat their data as a highly reliable guide rather than an absolute fact.
Most of these tools work by "scraping" product pages on a schedule. This means there can sometimes be small gaps or a slight delay between a price changing on Amazon and the tracker updating.
Practical Advice: Use a reputable tracker for its main strength—identifying long-term trends, competitive patterns, and historical context. For critical, split-second decisions like adjusting your price to win the Buy Box, always verify the price directly on the Amazon listing.
The real value of these tools is not in showing you the price at this exact moment, but in providing a detailed picture of your product's pricing journey over months and years.
My Price Is Stable, but My Ranking Is Dropping. What Gives?
This is a common and frustrating situation. If your price is stable and competitive, but your organic search rank is falling, it's a clear sign that something else is wrong. Price is a major factor for Amazon's A9 algorithm, but it's not the only one.
If pricing is not the issue, it’s time to investigate other aspects of your product listing.
Content Mismatch: Are you using the same language as your customers? The search terms shoppers use can change, and Amazon's AI, like Rufus, is constantly getting better at understanding them. Your content might be outdated.
Conversion Rate Problems: A sudden drop in your conversion rate sends a negative signal to Amazon. It suggests that shoppers are clicking but not buying, which will cause your ranking to fall.
Waning Social Proof: A recent series of negative reviews or unanswered customer questions can damage trust and push your product down in search results.
The Competition Got Better: It's a simple but common reason. Your competitors may have updated their listings with better keywords, improved images, or more persuasive A+ Content.
A stable price is just one part of the puzzle. If your price is solid but your ranking is still weak, the problem is likely in your content or customer experience.
How Is Cosmy Different from a Regular Price Tracker?
Standard price trackers are excellent at collecting data. They tell you what happened to your price. Cosmy is designed to answer the next, more important questions: why it affects your visibility and what you should do about it.
We don't just look at the price. Our platform connects pricing signals to a deep analysis of Amazon's AI ecosystem. We gather unique signals from Rufus, the AI shopping assistant, and other content indicators to show you exactly how your price history is influencing AI recommendations and shopper searches.
For example, a standard tracker will tell you your product is at an all-time low price. Cosmy goes a step further by running an immediate content audit. It might find that even at that great price, your content fails to answer key questions that shoppers are asking Rufus, causing you to be invisible in search results and miss out on sales.
In short, Cosmy connects the dots between your price, your content, and the AI's perception of your product. It helps you move from simply observing data to acting on real intelligence.
Ready to see how your content really stacks up in Amazon's AI-driven marketplace? Cosmy offers a free, guided audit to pinpoint visibility gaps and give you actionable insights in minutes. Start your free audit and turn guesswork into a competitive advantage today at https://cosmy.ai.